
One day, a colleague said to me:
Because you are.
This sentence made me laugh, but I found it so true that I immediately knew I’d be quoting it in my talk on incident management.
This blog post complements my previous Run! on the subject of RUN, to provide some additional developer tips.
As in the previous post, the examples are based on the Go language.
Logs
The first thing I’d like to talk about are the logs.
AWS definition: A log file is a software-generated file containing information about the operations, activities and usage patterns of an application, server or computer system.
A log acts as a kind of digital life trace, enabling administrators and developers to analyze program behavior, diagnose anomalies and track operations for better maintenance and optimization.
Logs are the footprints left by your program. Without them, there’s no investigation.
There are several log levels, the main ones being :
- INFO: Indicates that an event has occurred, but does not affect system functionality.
- WARN: Indicates that an unexpected event has occurred, which may disrupt or delay other processes.
- ERROR: Indicates that at least one system component is inoperative and interferes with the operation of other functions.
- FATAL: Indicates that at least one system component is inoperative, causing a fatal error in the overall system.
Let’s use logrus in Go to illustrate.
A typical example of logs that can be left in a program:
|
|
In this way, error or information logs are generated, depending on whether the operation was successful or not.
The concern here is that we’ll see messages like:
|
|
Sounds clear, but now imagine you need to troubleshoot an error concerning a user, you need to find error logs and info concerning a particular user ID.
We’ll certainly be able to retrieve the data, but on very verbose messages and in an absolutely non-optimized way.
It works, but as I mentionned in my previous blog post Run !, a log message should be as concise as possible. There are fields for additional information.
|
|
So, for example, if you want to look at the logs of a successful operation, you can retrieve them via a simple query.
Example via a Lucene query in Elasticsearch:
message: "user processing success" AND user_id:42
This logic applies to all log levels.
Having said that, there’s one overriding point concerning logs: avoid data gaps at all costs.
Log everything that needs to be logged, with the relevant fields.
There’s nothing worse than realizing only when troublehsooting that we’re missing information.
“Oh dear, I should have logged this information here”, “I should have put a field for this ID”.
A lack of information is a free ride to redeploy a patch containing the information you need to diagnose.
You really start to log differently when you start troubleshooting yourself and realize what your real needs are.
You have to anticipate as much as possible.
Note, however, that while too much information is better than too little, it’s important to differentiate between what’s relevant to log and what isn’t, in order to limit noise (and storage space).
Here is some information that I consider relevant to log in general:
- Request ID
- URL Path -> The paths of the endpoints called by your program
- HTTP Method
- HTTP Error Code
- User IDs (or IDs of the various elements you manipulate)
- Stack trace
- App Version
- Operation -> What you were doing at the time of logging
Monitoring
Having explored the importance of logs for tracing events and diagnosing incidents, it’s now time to address another pillar of observability: monitoring.
Monitoring enables you to anticipate problems by monitoring various metrics in real time, such as performance, system availability or the overall operating status of your system.
Key metrics include request latency, CPU load, memory usage, error rate, uptime, service response times, etc…
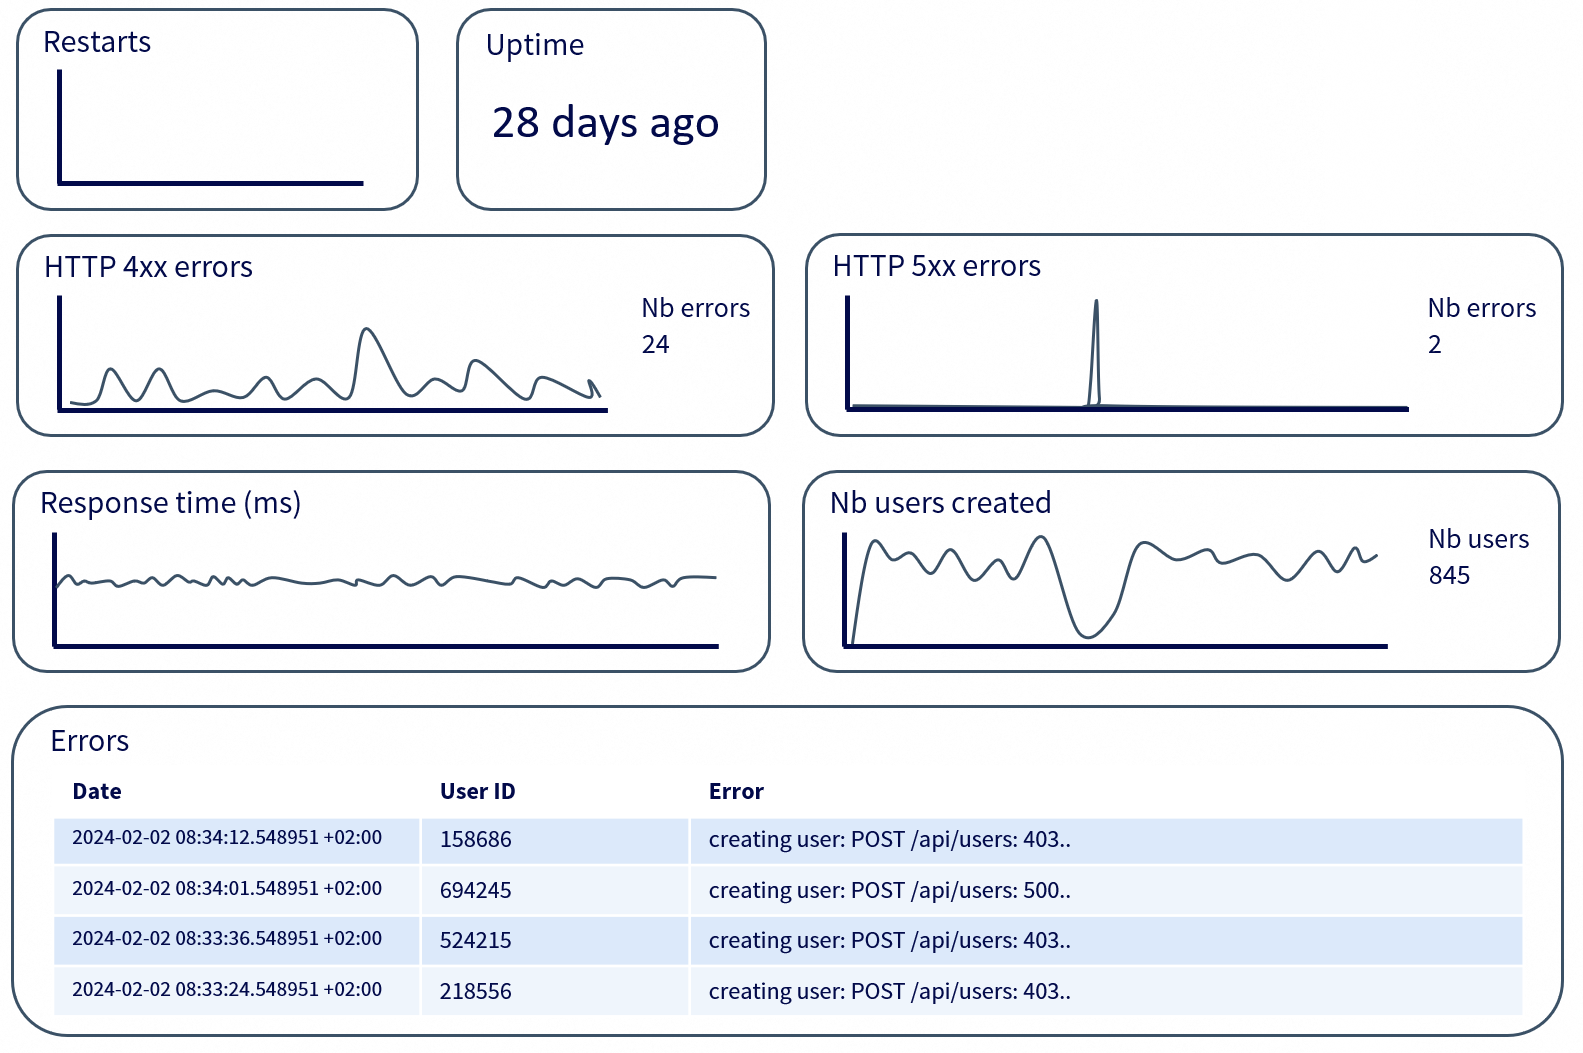
This is a classic illustration of what a microservice monitoring dashboard might look like, but dashboards can be made for an infinite number of other needs.
If you’re interested in more concrete examples, feel free to browse the dashboards on Play Grafana.
Errors
Error management is of paramount importance to any program, especially when it comes to diagnosing and understanding the problems encountered.
In Go, functions can return several values, and this is commonly used for error handling.
Generally speaking, any function likely to fail will return two values:
- The expected value (if the operation succeeds).
- An error (
error) as the second value (if a problem occurs).
Example:
|
|
Above all, an error is valuable information, and handling it correctly not only helps to trace the cause of a problem, but also to improve the readability and maintainability of the code.
There are several ways of handling errors in Go, the main ones being :
- Returning the raw error: Simple, but insufficient for good context.
- Error wrapping: Provides additional context on the cause of the error.
- Adding logs: Allows you to exploit the error by logging it correctly.
A frequent problem in error handling is the lack of context. When an error is returned as is, it can become difficult to exploit when debugging. You know that an error has occurred, but there’s no precise indication of its origin.
Let’s take a case where we load a user from a database:
|
|
If this function fails, the caller will receive the raw error from the database. The problem is that this error may be generic, with no details of the current operation.
To improve this, we can enrich the error with context using fmt.Errorf and %w :
|
|
From now on, the propagated error will include the user ID and the underlying cause.
Where error management really comes into its own is when it comes to differentiating between them. Not all errors need to be treated in the same way. Some are fatal, others simply need to be reported.
Go lets you test the type of an error with errors.Is and errors.As, so you don’t have to compare strings.
|
|
This makes the ErrUserNotFound error easily identifiable, enabling the caller to react accordingly without having to parse a textual error message.
When a function calls several services or performs cascading operations, chaining errors allows you to keep a complete record of the problem. This is what wrapping with %w allows.
A good error handling system is not only useful for displaying messages, it should also facilitate troubleshooting by providing maximum information without unnecessary noise.
An error devoid of context is as ineffective as a poorly structured log. If an error is to be propagated, it must be done so with all the information necessary to understand where it came from and why it occurred.
Alerts
The usefulness of error management and monitoring is called into question if no one is informed when a problem occurs.
This is where alerts come into play, automatically detecting and reporting critical anomalies.
This article is mainly about good dev practices for incident management, and it’s precisely these alerts that lead to the creation of incidents.
An alert must be reactive and relevant. Reactive, because it needs to warn the right people quickly, and relevant, to avoid the noise and fatigue associated with false alarms.
It’s pointless to receive a notification for every little anomaly, but ignoring a sudden increase in the HTTP 500 error rate would be a critical error.
Alerts can be triggered from several sources:
- Logs: Monitor an abnormally high volume of
ERRORorFATALlogs. - Metrics: Detect excessive latency, CPU overload or memory saturation.
- Application-Level Errors: Capture errors explicitly triggered in the code, such as
fmt.Errorf(...),throw new Error(...), orraise Exception(...). These may indicate business logic failures, assertion failures, or other critical conditions defined by developers.
Let’s take an example using Prometheus rules and Alertmanager to detect an increase in 500 errors:
|
|
Here, if more than 5% of requests fail with a 500 error over a period of 5 minutes, an alert is triggered after 2 minutes of problem persistence.
But an alert in itself is useless if it doesn’t reach the right people. A good alerting system needs to be integrated with tools like :
- Opsgenie, PagerDuty to wake someone up in an emergency.
- Slack, Mattermost, Microsoft Teams or Webex to notify the team.
The level of urgency of an alert must be defined according to its impact.
A simple latency spike on an uncritical request should not generate a critical alert, whereas a loss of connection to a database should immediately trigger an intervention.
It is this level of urgency that defines the priority of the resulting incident.
Last but not least, a well-configured alert should not simply be a warning signal: it should enable you to identify the cause of the problem quickly.
Linking alerts to logs, metrics and tracing is essential to avoid spending hours searching for the origin of an incident.
A critical error that goes unnoticed can cost thousands of dollars in downtime.
Conversely, a system that alerts too often for no reason will lose all credibility, and alerts will eventually be ignored.
Finding the right balance requires constant iteration and adjustment.
Code architecture
I’d like to end on a point I think is important: the larger the number of projects you have running in production, the more difficult it will be to apply all these methods if you don’t apply a certain rigor to your code architecture.
I have three pieces of advice for you:
Design and use an archetype.
If you know that your team will be developing a certain number of microservices with more or less similar objectives, have a solid base of code that you can reuse.
When you create a new project, this same database will, by default, allow you to have connections already established with your CI/CD, your artifact repository, your gateways, …
Design and use a solid collection of common packages.
Whenever you know you’re going to need an evolution that will be useful for all your projects, develop them within a collection of common packages that can be used as dependencies.
Whether it’s to improve your management of logging, alerting, profiling, HTTP requests, error handling, metrics and so on.
Use a linter
The subject of linters is vast, and I won’t dwell on it here.
However, their use is essential to ensure cleaner, more consistent code that conforms to best practices.
A linter can automatically detect potential errors, apply style conventions and avoid certain bad practices before the program is even run.
Some examples available in golangci-lint :
- govet: Detects potential errors (misuse of variables, logical errors, etc.).
- revive: Analyzes code style and conventions to make it cleaner and more maintainable.
- errcheck: Checks that all errors returned by functions are properly handled.
- staticcheck: Detects common errors, unused code and obsolete practices.
- gocyclo: Measures the cyclomatic complexity of functions to encourage simpler code.
There are certainly plenty of other good developer practices to be aware of in order to produce the most resilient code possible, but I’ve listed here the ones I feel are the most essential.
See you soon!
Sources
- https://preslav.me/2023/04/14/golang-error-handling-is-a-form-of-storytelling/
- https://www.crowdstrike.com/en-us/cybersecurity-101/next-gen-siem/logging-levels/
- https://aws.amazon.com/what-is/log-files/
- https://play.grafana.org/
- https://prometheus.io/docs/prometheus/latest/configuration/alerting_rules/
- https://betterstack.com/community/guides/logging/logging-best-practices/
- https://www.dataset.com/blog/the-10-commandments-of-logging/
- https://www.digitalocean.com/community/tutorials/handling-errors-in-go
- https://www.jetbrains.com/guide/go/tutorials/handle_errors_in_go/best_practices/
- https://www.ibm.com/think/topics/application-monitoring-best-practices
- https://www.keyprod.com/en/knowledge/production-monitoring