
Preamble
Today I’d like to talk about a professional experience that’s close to my heart.
Exactly a year ago, I had already been working as a software engineer for 12 years.
I started out as a web developer. I then became a deep learning specialist, before moving into cybersecurity to work on an IAM.
Although they were all different, these professional experiences all had one thing in common: I’d hardly ever touched production in my life.
During my web experience, as soon as I’d pushed my last commit, the code was no longer even in my hands.
My AI experience was based in a proof-of-concept team within an innovation hub.
In my IAM experience, I’d put my Jira tickets in “Done” when I’d pushed my last commit, then again: it was out of my hands.
Also, I’ve only ever worked on one project at a time. Or almost, but you get the idea.
That’s when I applied for a job in a team responsible for the company’s internal IS (information system). I discovered that they were developing and operating around 50 microservices and middlewares of all kinds.
I joined the team, found out a bit more in detail about what they do, and my boss then announced two annual objectives:
- I must be able to do RUN in 3 months’ time.
- I’m to join the night/weekend on-call rotation 2 months later.
I’ll go into a bit more detail on these two principles later, but I want to emphasize the fact that from my background, it was obvious to me that I was incapable of achieving these goals.
My thought was: “It’s crazy, my new boss has more confidence in me than I do in myself”.
In the end, I achieved these objectives without any problems, despite a certain apprehension.
How?
Incidents are going off in all directions, and most of the time I had never even touched the microservice that triggered the alert. So, how was I able to get by without too much trouble?
That’s the question I’d like to answer. I’d like to tell you what this team is like, what the organization is, and what tools they’ve put in place to help a newcomer integrate so quickly into this job.
I’m going to tell you what are, in my opinion, the essential strings of the RUN trade.
Note: In this article, I’ll focus on the RUN, which takes place during the day, and spend much less time on the on-call duty which takes place at night or on weekends.
Although we’re talking about incidents in both cases, they remain two different subjects.
My first incidents
RUN refers to all activities linked to the operation, supervision, and maintenance of systems in production. It opposes BUILD, which groups together development, integration, testing, and deployment activities, carried out from a prior design phase.
There are several aspects to this: real-time monitoring and incident response, management of security patches and fixes, SLA management and monitoring of availability KPIs…
The definition of RUN may vary, but I think the key idea to remember is that RUN is mostly rooted in the present: how it’s working, what’s happening right now, how to correct/improve.
In the case of my team, we mainly talk about incident management, although this can vary.
In an ecosystem where numerous microservices coexist, incidents can occur at any time. The causes can be numerous:
- A case not covered in the source code
- A called service that no longer responds
- A problem with the infrastructure
- Network latency
- A regression
- Etc.
And just about an infinite number of other reasons, but that gives you an idea.
As luck would have it, I joined the team right when a new need arose, so I was able to develop a new microservice from scratch.
Having developed a large part of its code and having all the code in my head, it was relatively easy for me, once in production, to understand what was happening in the event of an incident.
I’m not saying that finding the solution to a problem that arises on a project you’ve mastered is always easy, but at least you know roughly what you’re getting into.
That’s when I made the following reflection:
If it’s relatively easy in the event of an incident to form an intuition about a problem concerning a mastered subject, it becomes much less so on a subject that is unknown to us.
During my first week of RUN, I wasn’t feeling serene. My phone rang, I looked at the alert, and the name of the microservice vaguely rang a bell.
An alert message like [user-sync-service] creating user: POST /api/users: 403....
I’m not familiar with this project. The first thing I have immediately at my disposal is a prefix containing the name of the service and the start of an error message. Did you notice that in just a few characters, we’ve already got quite a bit of information?
That’s the whole point of properly formatting log and error messages in your code.
A good practice is to divide your alert message into three parts:
- A prefix containing the name of the affected service
- A very short message describing the operation concerned
- The error message that has been wrapped
At a glance, I’ve already understood that this is a microservice whose purpose is to synchronize users from one location to another. I understand that when trying to create a user to the destination via a POST endpoint, a 403 error occurred. So it’s potentially an authorization problem.
I’m far from being able to troubleshoot the problem, but I’ve already got a clue to guide my research.
For the record, synchronization (or interconnection) consists in transmitting information from one point to another. Generally between two tools that do not know each other and were not specifically designed to communicate with each other, but which each have a REST API offering CRUD operations.
The idea is to say: “I take data from one application, and I send it to another, taking its data format into account”. That’s the general idea.
Another example: [doc-sync-service] get document: unexpectedly empty result.
Obviously another synchronization. But this time, it seems the problem occurred when we tried to retrieve a document at the source.
I’d like to take this opportunity to stress the importance of writing error messages properly. I really like this vision proposed by this article, which we’ve adopted: https://preslav.me/2023/04/14/golang-error-handling-is-a-form-of-storytelling/
Obviously, I’m going to quickly get to know all the projects on my team. The goal isn’t to troubleshoot blindfolded all my life, but I prefer to keep two things in mind:
- On a dense perimeter, nobody will have the same level of knowledge on all projects.
- New people will always be able to join the team.
In conclusion: never rely on the team’s experience, assuming that everyone knows the projects inside out, and always be as clear and concise as possible in your error handling.
The course of a week’s RUN
I’m starting to get an idea of what incidents can look like, and now it’s time to start my first week of RUN.
I think there are a multitude of ways to manage RUNs. Without being exhaustive, I’ll just share with you our method and what I’ve learned.
To begin with, we work in RUN weeks. It’s a classic process, although not systematic depending on the teams. It means that we take turns within the team to take over the week.
Being in charge of the RUN means being in charge of the live operations. Live operations above all. This involves a number of things:
- Carrying out the morning check every morning
- Taking all incoming incidents in real time
- Monitoring ongoing incident tickets
- Being the team’s point of contact for urgent matters
Let’s take a closer look at these points.
Morning check
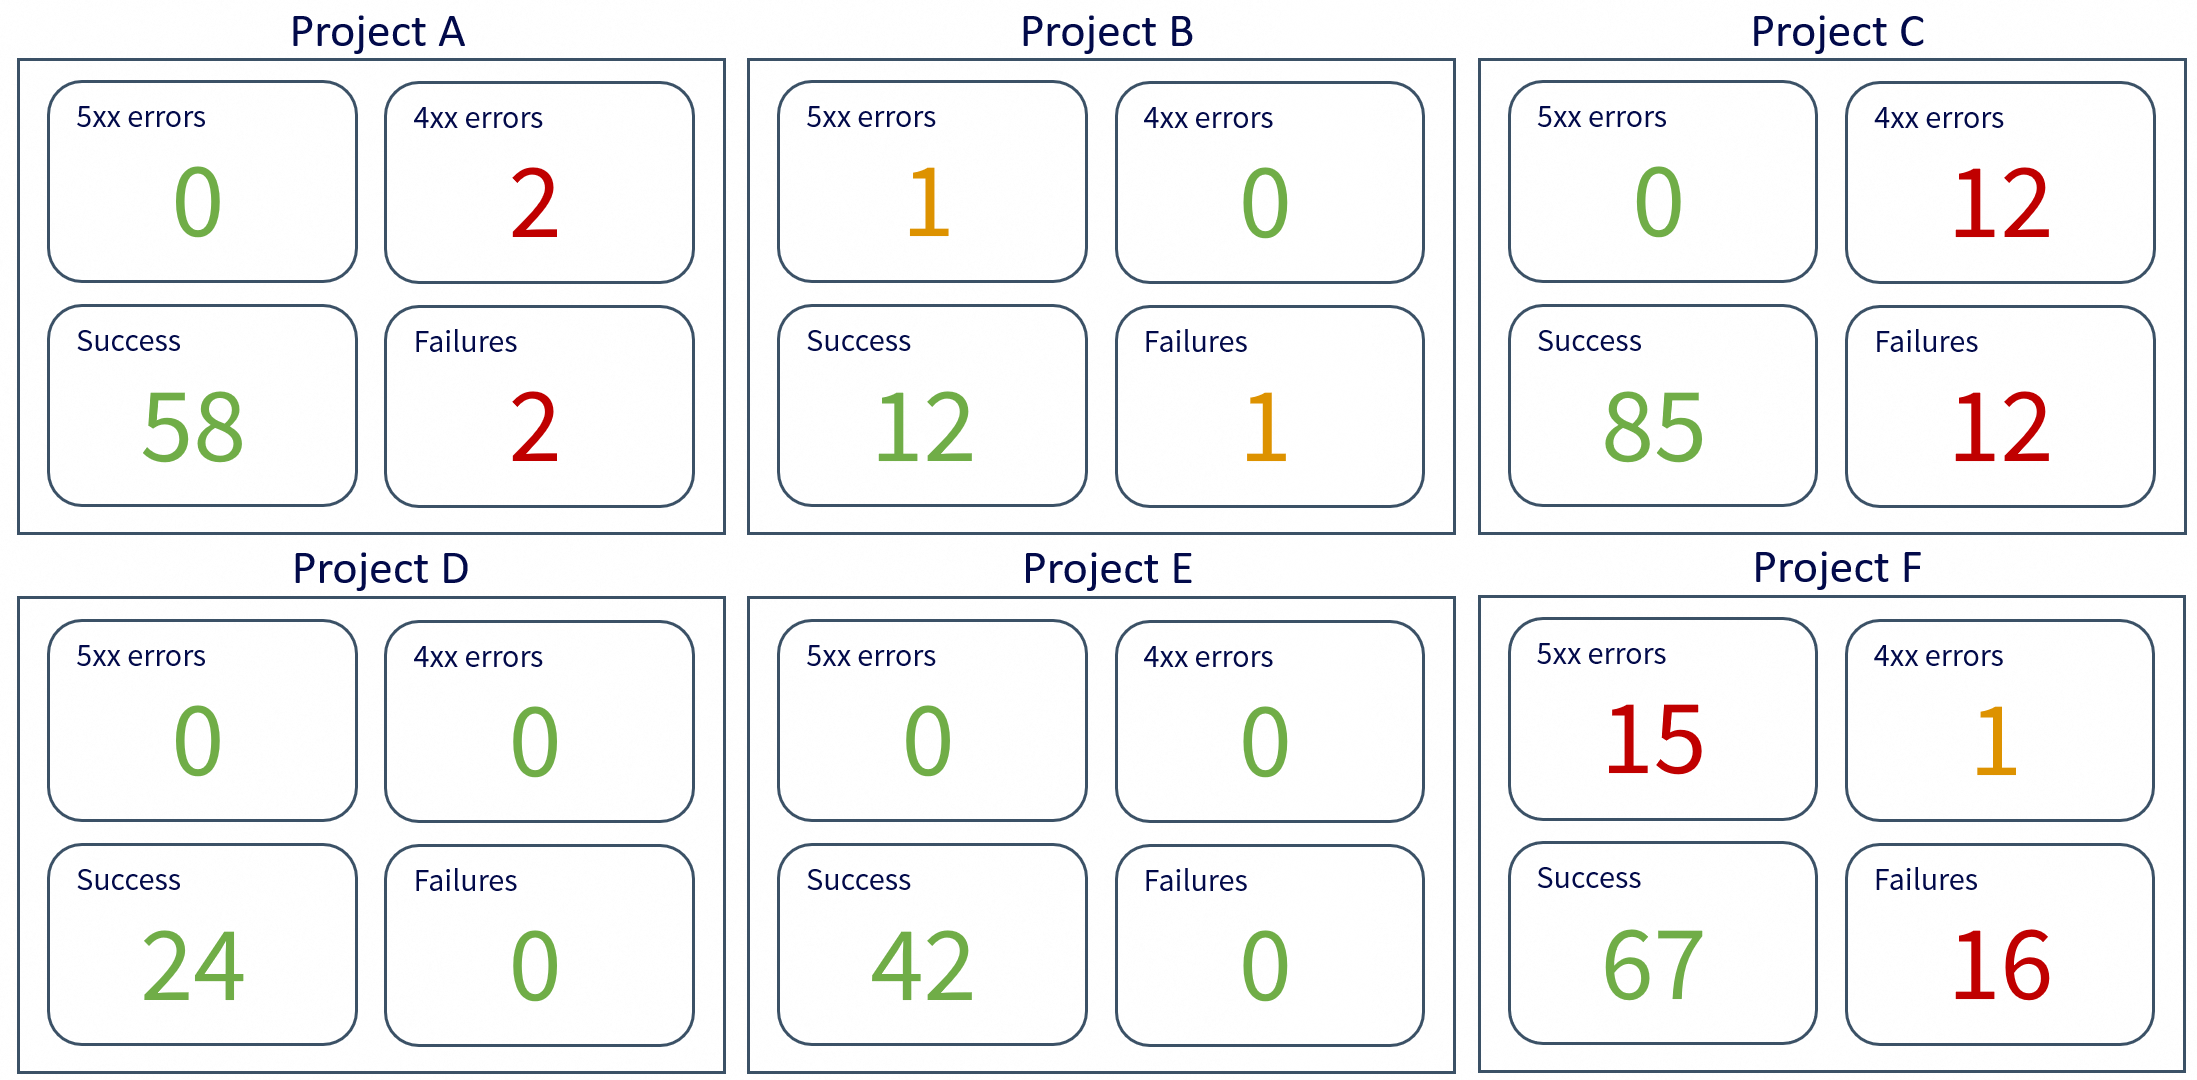
The morning check consists of consulting a central dashboard of all our services.
This dashboard is designed not to be an unreadable aggregation of all the team’s dashboards, but is meant to be a digest of the most important data.
You have to see very clear metrics and colors:
- Green: all’s well
- Orange: something to watch
- Red: something’s wrong, action to be taken
With a glance and a few scrolls, I need to be aware of the overall status of our entire perimeter.
This allows me both to check that no major problems have occurred overnight, and to anticipate potential incidents for the day ahead.
Incidents
The quality of an incident’s handling is qualified by two metrics:
- TTA: Time To Acknowledge, the time it took me to report that I acknowledged the incident.
- TRS: Time to Restore Service, the time it took me to resolve the incident and restore the situation to normal.
When an incident occurs, the priority is to acknowledge it, then take two actions:
- Assign the corresponding project (hence the need for clear log messages)
- Requalify the priority if necessary
Yes, because there are several levels of priority for incidents, depending on severity and urgency.
They are generally classified from P1 (maximum urgency) to P5 (minimum urgency).
Depending on the teams, a P1 will have to be resolved in a very short time (generally between 2 and 4 hours), while for a P5, you can have a good week or more.
P1s are the incidents that can go off at night or on weekends.
Obviously, for a P1 that occurs during the day (i.e. during the RUN), I’m not alone: it becomes the priority of the whole team.
Monitor tickets
Ongoing incidents are in the form of tickets, usually found on a dedicated dashboard.
It might look something like this:
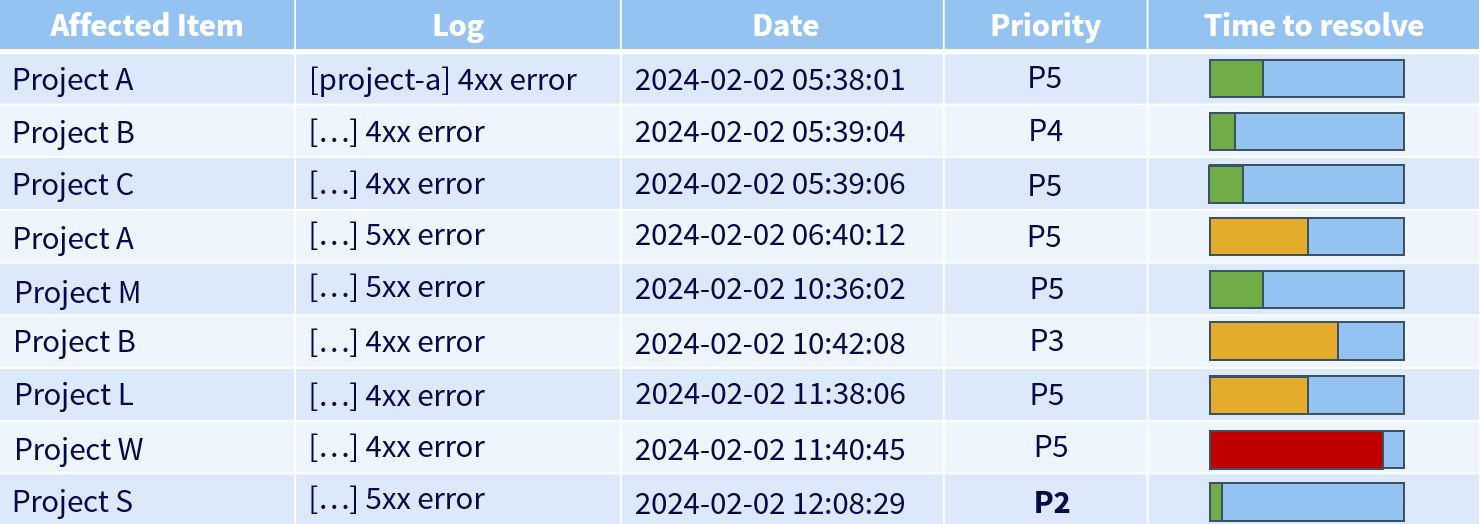
Here, I can see that project W, with its remaining resolution time, was the priority, until project S arrived with a much higher priority.
The person in charge of the RUN must always keep an eye on all tickets, whether they are assigned to them or not, to avoid letting the resolution time exceed the maximum time allowed.
In this case, it’s called a breach: exceeding the deadline (or, more generally, non-compliance with the SLA).
Be the point of contact
A team is rarely independent; it often shares its ecosystem with other teams. When you need to escalate an urgent issue to a team concerning a particular request or a bug you may have found, you’ll communicate with the team concerned in the hope of getting a rapid response.
Whatever your team’s communication medium (Slack, Webex, emails…), if you ask a question in a channel dedicated to a team, that team needs to be at least a little reactive.
This reactivity is then ensured by the fact that a member of this team makes monitoring the channels concerning them a priority in order to provide a quick answer and relay it if necessary.
Troubleshooting
Having said that, let’s get to the heart of incident management: troubleshooting.
Oracle definition: Troubleshooting is a logical and systematic process of problem-solving. Troubleshooting consists of searching for the source of a problem in order to identify its symptoms and eliminate potential causes until it is resolved.
Troubleshooting is like conducting an investigation: the aim is to understand what has happened with the information available to us, in order to restore service.
There are quite a few troubleshooting methods, but I’d like to focus on the ones I mainly use, starting with the Drill-Down.
The troubleshooting method known as “Drill-Down” consists of starting from a broad vision of a problem (the visible symptoms, the overall impacted scope) and then progressively descending to finer and finer layers to identify the precise cause.
We start by checking the most general elements: service availability, overall infrastructure state, key metrics, etc.
Then we “dig”: component by component, layer by layer (network -> server -> application -> configuration -> code), until we isolate the faulty element.
It is a structured and rigorous approach. Its flaw is that it’s not the fastest, especially if you dig in the wrong direction, but in my opinion, it is one of the best methods for establishing what is called the Root Cause Analysis (RCA): identifying the root causes of faults or problems.
Also, this method has the immense quality of being an excellent way to upskill on a project about which one might have limited knowledge.
The rigor of this troubleshooting method can bring to mind the “Bottom-Up” method, which involves starting by examining the physical components of a system (lower layer) and gradually moving up the layers of the OSI model until the cause of the problem is identified. This approach is effective when you suspect the problem lies in the lower network layers.
By applying this method in a purely software domain, we start by checking the runtime environment: ensuring the application is running, processes are active, and deployment is correct. Next, we check system dependencies, like the database and associated services, as well as the versions of the languages used.
We then test connectivity: does the web server route requests properly? Does the application access necessary resources?
Then, we analyze configurations and logs to identify potential errors.
If everything seems in order, we examine the source code to spot recent bugs or problematic modifications.
Finally, we test the user interface by inspecting the browser console and network requests to see if the problem comes from the frontend or backend.
I don’t claim to be exhaustive here, but it gives an idea of the approach to take when conducting the investigation.
However, I would like to emphasize one point: while performing a root cause analysis is essential, it is not necessarily the priority.
When an incident occurs, especially a critical one, a paramount question to ask yourself is:
“It doesn’t work” => what doesn’t work? All of it? A particular scope?
Are we able to reproduce the error systematically?
Although I’ve been talking about troubleshooting in the sense of solving an investigation all this time, we must never lose sight of the initial objective: restoring service, and as quickly as possible.
When your customer loses access to their website hosted by you, it’s easy to fall into the trap of immediately wanting to do the RCA (root cause analysis). There’s a problem, and you want to understand why.
We must sometimes accept the fact that understanding the cause of a problem can take time, and prioritize the availability of the service above all else.
Case study 1: night incident
I’d like to start with a practical example of an emergency situation. Let’s step away from the RUN for two minutes to talk about a night-time on-call incident.
Your customer has a problem with his website, it suddenly became very slow and a large number of incoming requests are being lost.
It’s 4am.
You investigate, and you see that it’s a load-balanced website on 3 virtual machines.
My first reflex is then to assess the impact of the incident by looking at the various monitoring dashboards involved, then looking at the logs associated with the problem.
My next reflex is then to connect via SSH to each of these machines to see what is happening. On one of them, nothing to report.
On the other two, there is almost no response. The SSH connections take a long time, the slightest remote command takes about thirty seconds to execute. You then painstakingly manage to display the resources, which are hovering around 100% CPU / 100% RAM.
Initial assessment: two out of three machines are no longer able to provide the requested service.
The website has huge traffic, it’s a top priority and you don’t have a minute to lose. Asking the customer to wait for a full troubleshooting before restoring his service is unthinkable.
You’ve got to save time.
It is out of the question to hastily restart the machines that are no longer responding; an investigation is required.
My first instinct was then to head for the load balancer to redirect all incoming requests to the only server still standing.
As load balancing was not implemented without reason, this solution is obviously not viable in the long term, but at least service has been restored.
We still need to make sure that the single functional server will be able to hold the load for the next few hours. Increased monitoring (hypercare) for a good hour is required before going back to bed.
The service is hanging on by a thread, but it’ll last through the night until my colleagues wake up.
The next day, we were able to carry out all the necessary troubleshooting as a team, in order to correct the problem durably and distribute the load across the 3 machines once again.
Case study 2: taking a step back
Let’s move on to a slightly less urgent case, typical of the RUN. There are so many examples of troubleshooting that I don’t know which one to choose.
I have chosen the case that I am about to present for two reasons: it’s one of the first cases I had in my current job, and it’s the first where I realized the importance of stepping outside my frame of thinking.
What I mean by this is that, as I said earlier, when an incident occurs, we immediately form an intuition based on the sparse information we have at first sight, and then dig deeper. But troubleshooting often boils down to more than that. Most of the time, there’s a whole context to take into account: business constraints, the services that revolve around the one concerned, the infrastructure on which it runs…
I’m going to modify the example slightly for reasons of confidentiality, but the principle remains the same.
Let’s take our microservice for synchronizing users from point A to point B:
[user-sync-service] creating user: POST /api/users: 500....
This is a 500 error. The microservice failed to push the users to the destination. Failed pushes, then.
My first reflex is to look at the metrics dashboard to assess the extent of the damage. I see that there are around 20% of requests in error 500 for 80% of requests in 200 on the same route.
Right away, we can say that not everything is down.
I also notice that this synchronization sends a lot of requests in a short space of time.
I then thought of a problem due to rate limiting or request overload, but looking at the history of other synchronizations, I see we are on a volume similar to what we’ve always had.
Next, let’s take a look at the logs.
Note: a well-crafted log message, error or not, will only contain a very simple message regarding what we were trying to do.
All other information will be found in the log fields, which we can use to filter.
So I start by filtering all the log messages containing an error, in order to find a common point. Knowing that we always include an “operation” field, which is a sort of code for the operation performed when the message was sent, I decide to display it to see.
|
|
The first thing I notice is that all the errors carry the same message and the same operation.
So there seems to be a problem with user creation, that’s what the messages seem to indicate.
I could then dig into the user creation process to see what’s wrong, but I remember a good proportion of the requests were 200s, and tell myself that just filtering on errors is certainly not enough.
I therefore remove this filter and display all the messages around the error messages:
|
|
In reality, there are plenty of createUser operations going well. The problem may not lie with the operation itself.
I browse through the available fields and one catches my attention: the pod_id, the ID of the pod on which the microservice is running on the infra side.
I decided to display it:
|
|
And then something hits me: after checking, absolutely all the messages, success and error alike, come from the same pod.
Yet, I have some basic knowledge about this microservice and I know that it’s supposed to run on two pods, notably to distribute the load. That’s suspicious.
So rather than head to the source code, I connect to the infra to monitor the status of the pods, and bingo: one of the two had gone down.
The load then found itself concentrated on a single pod, which then found itself struggling to handle everything, and dropped some of the requests.
So it really was request overload after all.
I restarted the pod, restarted the synchronization, the load was once again distributed between the two pods, everything passed.
All that’s left now is to dig into why this pod crashed, but a large chunk of the RCA has been established.
We can close the incident.
This example shows that having an overview of the information we have at our disposal can allow us to broaden our intuition towards a cause that wasn’t necessarily suspected at first sight.
The Five Whys
I’d like to finish talking about troubleshooting by mentioning another method called the “Five Whys”.
Wikipedia definition: The five whys are an iterative interrogative technique used to explore the cause-and-effect relationships underlying a particular problem.
The main aim of this technique is to determine the root cause of a defect or problem by repeating the “why?” question five times, each time linking the current “why” to the answer of the previous “why”.
The method claims that the answer to the fifth “why” asked this way should reveal the root cause of the problem.
Example:
Problem: I’m late for work.
Why? I left home later than usual.
Why? My alarm didn’t go off.
Why? My phone was off.
Why? The battery was empty.
Why? I didn’t plug my phone in before going to sleep.
The cause of my lateness at work would therefore be having forgotten to charge my phone, and a solution so it doesn’t happen again would be for me to pay more attention to it in the future.
This example is very classic and is quite handy for illustrating the pros and cons of this method.
- Advantage: it pushes you to take a step back on incidents that occur.
- Disadvantage: it oversimplifies problems a little too much. Remembering to charge my phone guarantees in no way that I’ll be on time for work in the coming days.
Let’s take another technical example:
Problem: Users can no longer log into the application.
Why? The authentication system returns a 500 error.
Why? The authentication service is unable to query the user database.
Why? The authentication service cannot establish a connection with the database.
Why? The database server is unreachable.
Why? A recent firewall configuration change blocked the authentication service from accessing the database.
This method remains interesting to take a step back before rushing headlong into resolving an incident, and is often used when writing post-mortems to get another perspective on the problem.
Troubleshooting is quite a vast field. I do not claim to have been exhaustive but I hope I was able to give you some food for thought on the matter.
Being a resilient developer
Here, I’ve outlined the main axes I wanted to cover regarding RUN.
However, I still ask myself one question:
What I mean to say is that if I was able to so quickly grasp these tools and access information in the event of an incident, it is because these tools and this information exist.
Software and microservices are written by developers, and these developers have their part to play in the troubleshooting process long before the incidents themselves.
I want to talk to you about the good dev practices that are necessary for proper incident management, and for that I’ve written a blog post Being a resilient developer dedicated to this theme.
If I had to summarize one idea behind this article, it would be this:
“Develop your applications as if you were going to maintain them, because you are!”
Don’t hesitate to read it if you’d like to know more about the day-to-day life of a developer working in an incident context, otherwise I’ll let you finish this read with a brief final note!
A quick word on night on-call
This is where this blog post on incident management in RUN ends.
I preferred to focus on this aspect of incident management because it represents my daily life more than night on-calls, even though I was able to detail a typical night case, but it’s really something that can vary across teams.
I want to leave you with a little blog post that I really liked about things that I think are useful to keep in mind when you’re on night call: What I tell people new to on-call
I hope these few lines (or rather a few pages) have taught you things and given you an idea of the day-to-day life of engineers who regularly rub shoulders with incidents.
Conclusion
This transition to RUN radically changed my vision of the job. For twelve years, I lived in the comfort of abstraction, where a software engineer’s work stops at developing their code. Today, I know that the code is just a step and that the end goal is for it to run.
RUN is not just a chore or a succession of alerts. It is the moment when you face reality. It requires humility: you have to accept that you cannot master everything across fifty services, but that with method, you always end up figuring it out.
If I had one piece of advice for those who, like me, have always been afraid of production: do not be apprehensive. It is not trying to trap you, it teaches you to code better. By assuming responsibility for what we build, we don’t just become more well-rounded developers, we become more resilient engineers.
Sources
- https://www.ibm.com/think/topics/it-operations
- https://preslav.me/2023/04/14/golang-error-handling-is-a-form-of-storytelling/
- https://www.maddyness.com/2019/12/23/startupers-build-et-run/
- https://www.oracle.com/fr/security/troubleshooting-depannage-resolution-problemes/
- https://ntietz.com/blog/what-i-tell-people-new-to-oncall/
- https://en.wikipedia.org/wiki/Five_whys
- https://medium.com/@dzanna.molly/devops-troubleshooting-strategy-2b5b38a5f3b7
- Monitoring efficace : comment sauver votre production rapidement - Antoine Beyet (https://www.youtube.com/watch?v=6pRBWM-J-c8)